Anthropic has overtaken OpenAI in U.S. business AI adoption for the first time. The May 2026 Ramp AI Index put Anthropic at 34.4% of tracked U.S. businesses paying for AI, ahead of OpenAI at 32.3%. The company quadrupled its enterprise footprint in 12 months, and by February was winning roughly 70% of head-to-head matchups among first-time AI buyers.
Both companies ship comparable frontier models. Both have enterprise sales teams, deep partnership networks, and mature developer tools. The architectures each company built around its models are radically different, and those architectures are what compounded.
In our full analysis, What Disney's 1957 Synergy Map Reveals About the Five Companies Defining Enterprise AI, we mapped the synergy architectures of the five companies positioned to shape enterprise AI through the next decade: xAI, OpenAI, Anthropic, Microsoft, and Google. The Disney map is one of the most enduring frameworks in corporate strategy, showing how the connections between a company's businesses produce more value than any single business does on its own. The strongest competitive position belongs to the company drawing the tightest connections between its businesses, regardless of how many businesses it runs.
The same dynamics play out inside any organization deploying AI. Four patterns from the analysis describe how architectural choices compound, and each one applies the same way at smaller scales.
The narrowest map is winning
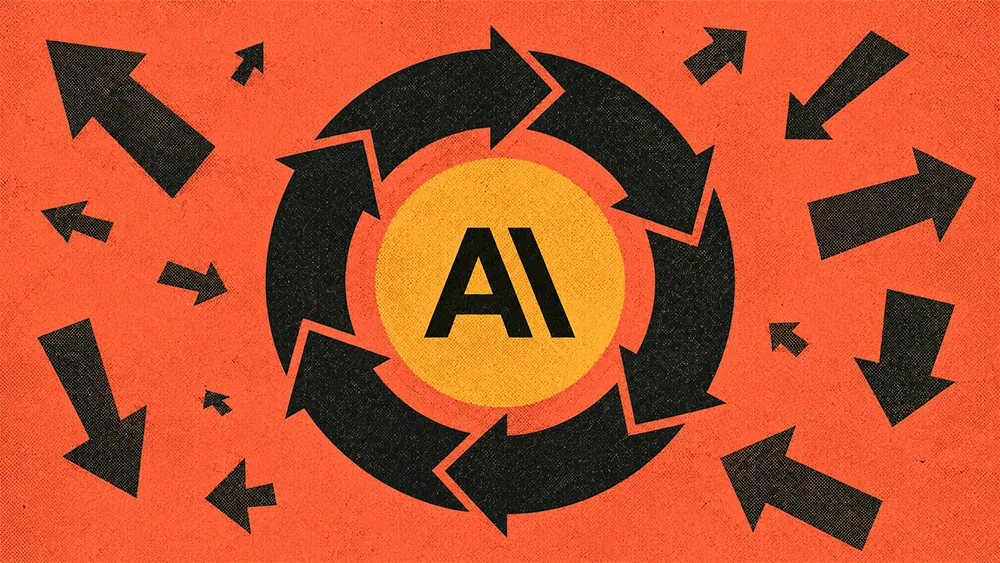
Anthropic's synergy map has the fewest nodes of any company we analyzed. No social media platform. No chip fab. No advertising tier. No satellite network. The narrowness is the strategy. Claude Code drives bottom-up developer adoption. Developer adoption feeds enterprise sales. Enterprise deployments generate domain-specific data. Better data improves the models. Better models make Claude Code stickier. The loop runs faster with every cycle.
Claude Code now accounts for an estimated 4% of all public GitHub commits worldwide, double the share from a month prior. Five industry verticals launched in 18 months. PwC is training 30,000 professionals on Claude. JPMorgan Chase, Goldman Sachs, Citi, and AIG all have Claude in production. A new $1.5 billion joint venture with Blackstone, Hellman & Friedman, and Goldman Sachs is embedding Claude into mid-market operations. Every arrow on the map reinforces every other arrow.
The biggest map runs the weakest flywheel
Microsoft has the most boxes on its chart of any company we analyzed. 450 million M365 users. Azure is at a $70+ billion annual run rate. Roughly 90% of the Fortune 500 are running some form of Microsoft AI. Four distinct agent-building surfaces. Annualized Capex at $150 billion. Copilot has converted 3.3% of that commercial installed base to paid seats, and its share of the U.S. paid AI subscriber market dropped 39% in six months.
Microsoft's surface area is extensive, but the connections between its boxes are weak. The AI is everywhere, and the value is not compounding. The same dynamic shows up inside any organization running 20 parallel AI pilots that don't feed each other.
Every handoff is a margin leak
Google's chart is the largest by surface area: custom TPUs in their eighth generation, Gemini 3 leading the AI leaderboards, Search reaching 2 billion AI Overview users a month, Cloud at a $70+ billion annual run rate, YouTube generating more than $60 billion across ads and subscriptions, Android on 3 billion devices, and Workspace embedded across the enterprise. Planned 2026 capex landed at approximately $180 billion.
The structural advantage is zero internal toll booths. When a query flows from Search to Gemini to Cloud to TPU and back, no margin leaks to a third party at any layer. Every other frontier AI company pays rent somewhere along its stack, most commonly to Nvidia for accelerators and a hyperscaler for compute, with both taking margin on every cycle the underlying model runs.
The same dynamic shows up inside any organization running a multi-vendor AI stack. Every handoff between systems adds latency, cost, and data leakage. Count the seams.
AI pricing is about to restructure the vendor relationship
OpenAI signaled the shift in January 2026, when CFO Sarah Friar published a pricing roadmap describing the company's next phase of monetization. The plan moves OpenAI from selling tokens to outcome-based pricing, where the vendor takes a percentage of the value its AI generates inside a customer's business.
That is a different commercial relationship than a SaaS subscription. The AI vendor stops being a tool provider and starts being an economic participant in the workflows it powers. The shift cuts two ways. It raises the ceiling on what platform-layer companies can capture from any single account, which is the reason every frontier lab is moving in the same direction. It also gives buyers a reason to build internal agent capability on top of frontier models, since keeping the upside in-house gets more valuable as the share vendors capture goes up.
Contract terms signed in 2026 will lock those structures in for years. The model embedded in any given contract can be swapped down the line. The commercial terms underneath cannot.
The full analysis goes deeper into the architectures behind each of the five companies, the structural trade-offs underneath each bet, and the five-step process for drawing the synergy map for any AI strategy.
Read it here: What Disney's 1957 Synergy Map Reveals About the Five Companies Defining Enterprise AI