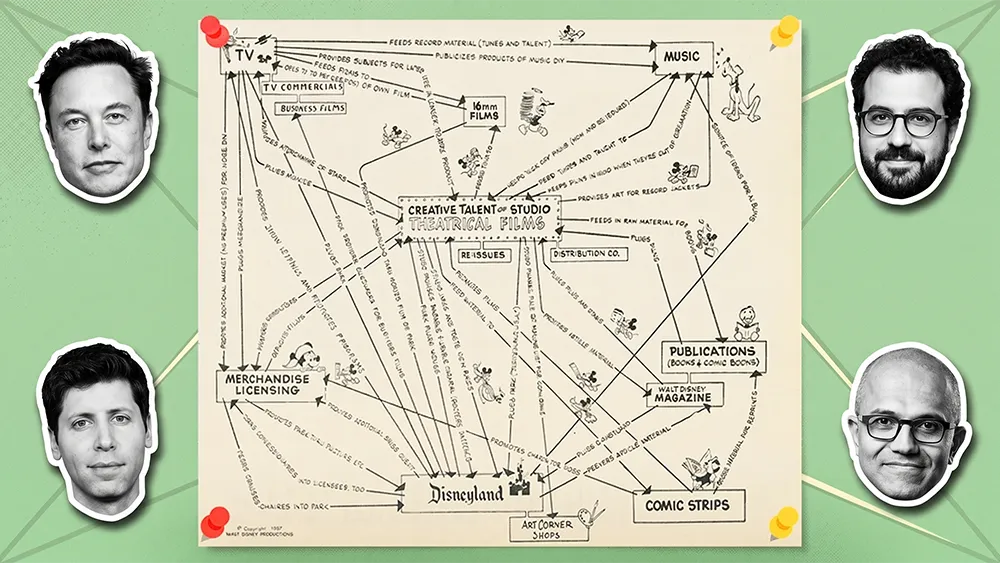

In 1957, Walt Disney sat down with paper and pencil and drew a map of his company. Every division, from theatrical films and television to music, merchandise, theme parks, and publications, appeared as a node, with arrows running between each one showing how every part of the company fed every other part. Films created characters. Characters sold toys. Theme parks turned IP into an emotional anchor. Television amplified the system. No orphan boxes. Every node gave and received. The map functioned as a flywheel before anyone in business used the word.
The point of the chart was that none of Disney's divisions was worth what the system was worth. A standalone film studio competed with other film studios. A standalone theme park competed with other theme parks. The arrows between the divisions were where the actual moat lived. Sixty-nine years later, Disney still cites the chart in investor materials. During its 2024 proxy fight with Blackwells Capital, the board held up the synergy map as proof that breaking up the company would destroy value. The board argued that the connections between the businesses created more value than the businesses created on their own.
The insight Disney mapped in 1957 applies to any company complex enough to run multiple businesses. In 2026, AI is the industry where it matters most. Every frontier lab has shipped capable models. The gap between them has narrowed enough that buyers no longer treat benchmark scores as the deciding factor. Capability is the entry ticket. The race has moved one layer up, into the architecture each lab builds around its model. That architecture looks radically different across the field. xAI runs its model inside Tesla and SpaceX. OpenAI runs a consumer app, an enterprise business, an advertising tier, and a chip program in parallel. Anthropic stacks vertical-specific enterprise divisions on top of a developer platform. Microsoft and Google push AI across dozens of existing product surfaces.
This analysis maps the synergy architectures of the five companies positioned to shape enterprise AI through the next decade: xAI, OpenAI, Anthropic, Microsoft, and Google. For each, we identified the core engine driving the business and traced the connections to every other node in its portfolio. Each of these companies operates as a system of interlocking businesses, and the quality of the connections between those businesses determines where each one is positioned to lead, where it is exposed, and where it may lose ground over the next several years. The findings carry real consequences for anyone tracking where AI value will accrue over the next several years, from leaders evaluating vendor relationships and contract structures to investors and strategists assessing competitive position across the field. The largest synergy maps do not always belong to the strongest flywheels. In several cases, the analysis reveals the opposite.
xAI: One node in the Musk machine
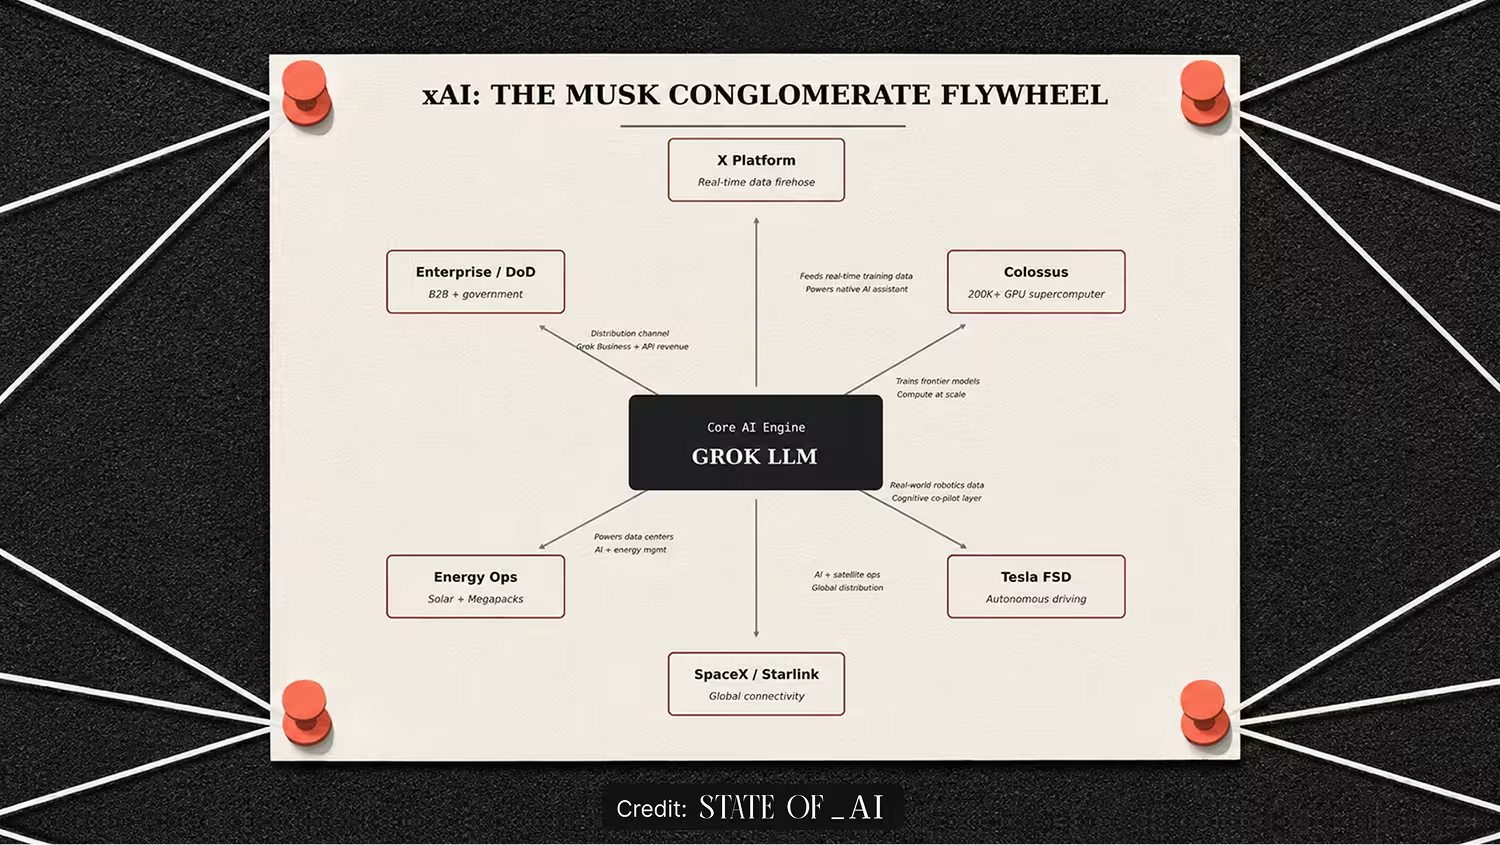
No AI company has a synergy map like xAI's, because no other AI company lives inside Elon Musk's portfolio. xAI acquired X in March 2025 in an all-stock deal at a $113 billion combined valuation, grafting a frontier AI lab onto a real-time global data firehose. In February 2026, SpaceX acquired xAI in a deal valuing the combined entity at $1.25 trillion, with the AI operations later organized into a "SpaceXAI" division that unifies AI, social media, and aerospace under one entity. The cross-industry arrows on xAI's synergy map outnumber every competitor's.
The core engine is Grok, powering everything from consumer chat on X to a $200 million Department of Defense contract. Grok is trained on Colossus, one of the world's largest AI supercomputers, with hundreds of thousands of GPUs across multiple buildings in the Memphis region and a publicly stated target of 1 million. X's hundreds of millions of users generate proprietary real-time data that distinguishes Grok's training corpus from competitors relying on static web scrapes. Grok is integrated into Tesla vehicles for voice and navigation commands, with deeper integration into Tesla's broader AI stack signaled as a future direction. Starlink provides the global connectivity backbone. xAI is building a solar farm adjacent to its data centers, with Tesla Megapacks for power management.
The ambition runs further than any competitor's, but the execution lags far behind. Revenue was on track for $500 million in 2025, with internal targets of $2 billion for 2026 and positive cash flow projected by 2027. In the third quarter of 2025 alone, xAI posted a $1.46 billion loss on $107 million in revenue, with cash burn approaching $1 billion a month. Most of the arrows on the chart are drawn but not yet flowing. The cross-portfolio bet remains largely potential, with a wide gap between what the synergy map promises and what xAI has so far delivered.
Two lessons sit inside xAI's map. The first is that most enterprises sit on the most underleveraged AI input on their own balance sheet. Customer service transcripts. Operational telemetry. Supply chain signals. Financial workflows. When those datasets stay in silos rather than feeding the AI systems, the result is boxes without arrows. The second is that drawing the arrows is the easy step. Making the data flow between them requires governance, integration, and infrastructure investment that most enterprises underestimate. xAI shows what is possible at extreme scale. It also shows how much work stands between possible and built.
OpenAI: Pricing as strategy
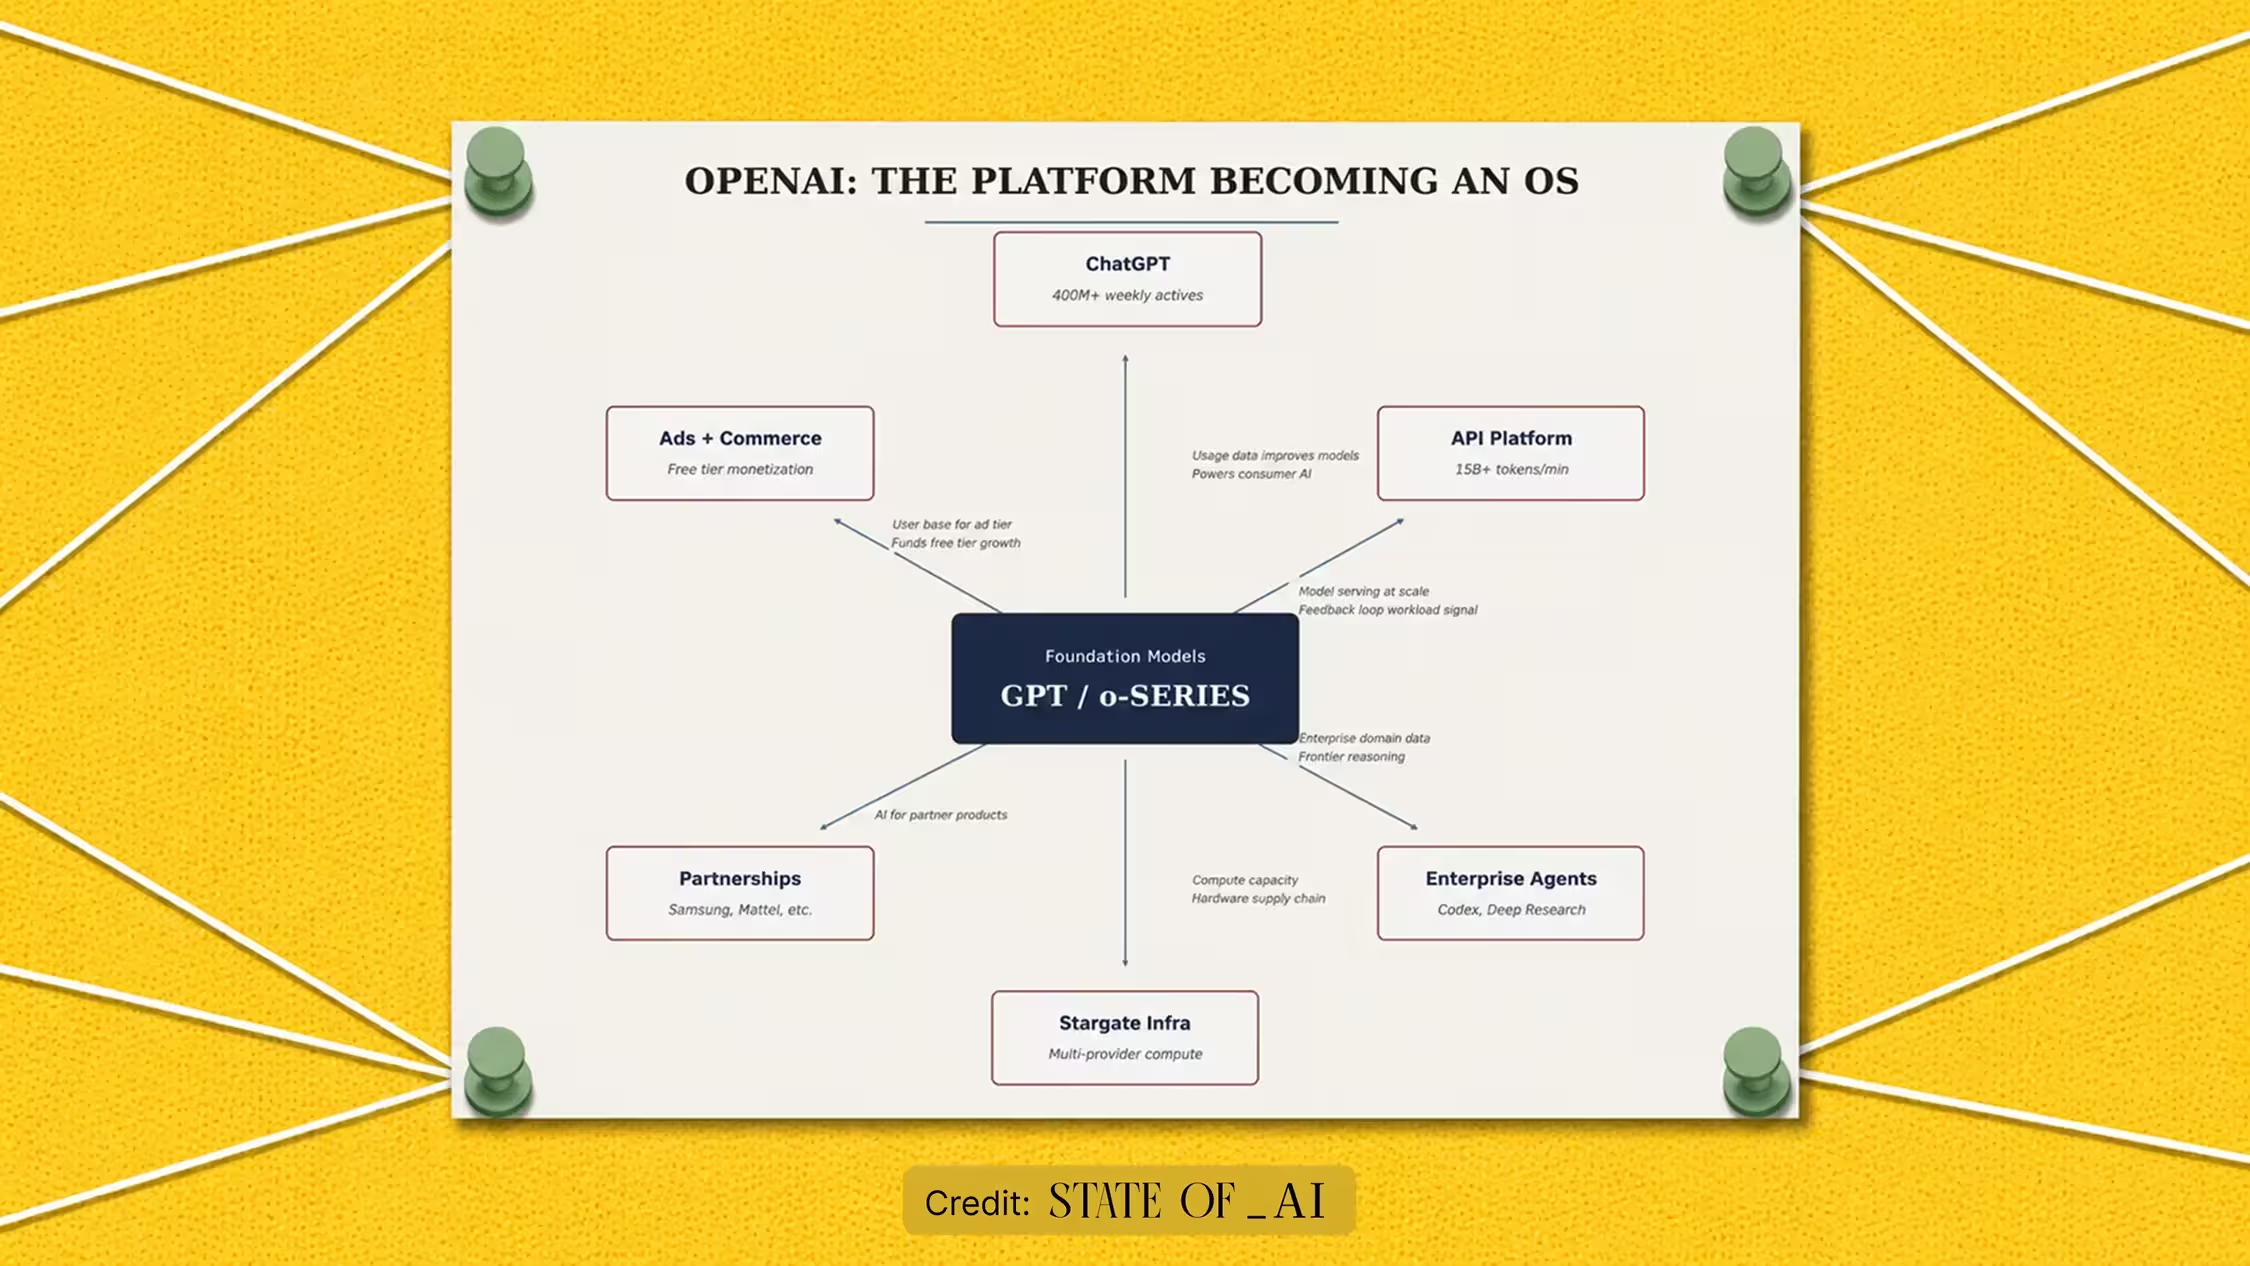
OpenAI's synergy map has been redrawn twice in 18 months. The first version was simple. A research lab selling API tokens. The current version is a multi-sided platform that OpenAI's leadership describes as evolving toward an "AI super-assistant" and, eventually, an operating system for digital life. The scale shift behind that repositioning is staggering. Compute grew from 0.2 GW in 2023 to 1.9 GW in 2025. Revenue grew from $2 billion ARR in 2023 to more than $20 billion in 2025, with projected revenue of $29.4 billion for 2026. Codex hit 3 million weekly active users. Enterprise passed 40% of revenue and is on pace for consumer parity by the end of 2026. The API processes over 15 billion tokens per minute.
The core engine is the GPT and o-series model family. The arrows multiplying around the engine point in three directions, each one widening where OpenAI captures value. The first is integration. ChatGPT is becoming a hub where third-party apps plug directly into the model, letting users take action across Spotify, Mattel's design stack, and dozens of SaaS platforms without leaving the chat window. Every integration makes ChatGPT harder to abandon for a competing assistant. The second is infrastructure. The Stargate initiative is building OpenAI's own data centers, reducing its long-standing dependence on Microsoft Azure and giving OpenAI control of its cost structure and compute capacity. The third is consumer scale. A new advertising and commerce tier inside ChatGPT is funding free-tier expansion to four times the size of Google Gemini's user base, generating the data that trains the next generation of models. More users produce better models, which attract more users.
The strategy came into focus in January when OpenAI CFO Sarah Friar published a blog post outlining the company's next phase of monetization. Friar wrote that as AI moves into drug discovery, energy systems, and financial modeling, OpenAI's revenue would expand beyond subscriptions and APIs into licensing, IP-based agreements, and outcome-based pricing. "That is how the internet evolved. Intelligence will follow the same path," she wrote. OpenAI is moving from selling tokens to taking a percentage of the value its models generate. The platform expansion and the pricing shift are the same strategy. Each new product surface is another place to attach an outcome-based fee.
The pricing shift matters more than any model release. Outcome-based pricing turns the cost of AI from a controllable line item into a variable tied to the enterprise's own revenue, with the vendor taking a share of whatever value the AI produces. The same shift is redefining where AI value accrues across the industry, with the AI provider becoming a participant in the economics of every workflow it touches rather than a supplier of inputs to it. Contract terms signed in 2026 will lock those structures in for years, and the model embedded in any given contract can be swapped down the line while the commercial terms underneath cannot.
Anthropic: The tightest loop in AI
Anthropic has the most deliberately constrained synergy map of the five companies in this analysis. No advertising tier. No social platform. No consumer hardware push. No chip program. The narrowness is the strategy. In 2026, it produced the biggest competitive shift in enterprise AI.
The May 2026 Ramp AI Index put Anthropic at 34.4% of tracked U.S. businesses paying for AI, ahead of OpenAI at 32.3%. The lead is the first of its kind for Anthropic, capping a year in which the company quadrupled business adoption and started winning roughly 70% of head-to-head matchups among first-time enterprise AI buyers by February 2026. The growth came from one product loop running tighter than any competitor's, then earning the right to extend into adjacent territory.
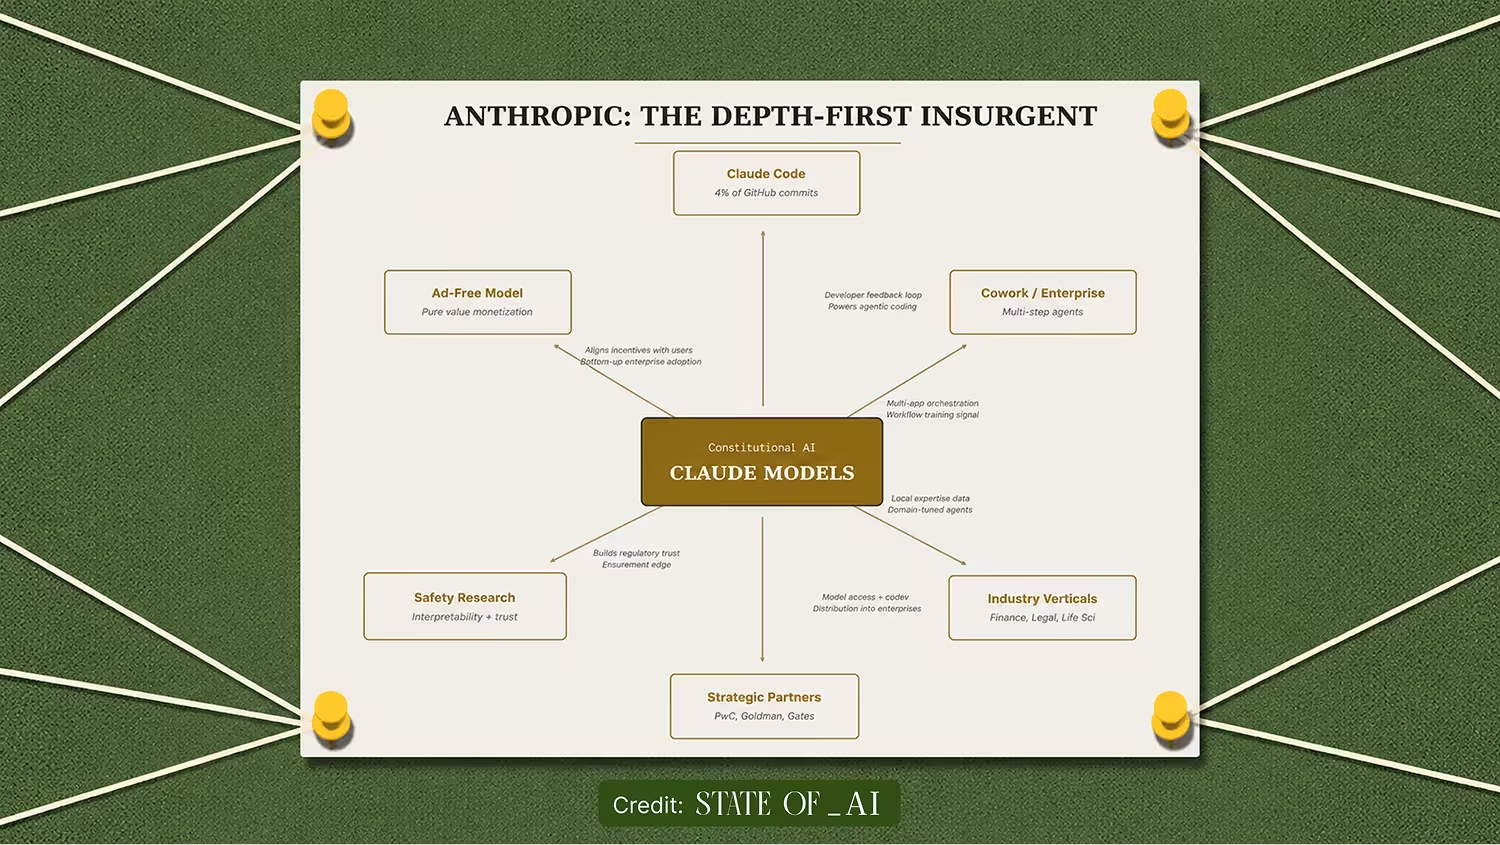
The loop runs through Claude Code, an agentic coding tool that accounts for an estimated 4% of all public GitHub commits worldwide, double the share from a month prior. Developers adopt Claude Code individually. Their productivity attracts the attention of enterprise buyers, who sign expanded contracts. Those enterprise deployments generate domain-specific data that Anthropic uses to improve the models. Improved models make Claude Code more useful, which pulls in more developers. Bottom-up adoption and top-down sales feed each other inside one product, which is the loop that other labs are still trying to build.
That loop earns Anthropic the right to layer industry depth on top. Five market-specific verticals launched in 18 months: financial services with JPMorganChase, Goldman Sachs, Citi, and AIG in production, plus legal, life sciences, education, and small business. Each vertical comes with tailored agents, pre-built workflows, and curated third-party integrations. A new joint venture with Blackstone, Hellman & Friedman, and Goldman Sachs is embedding Claude into mid-market operations. PwC is training 30,000 professionals on Claude. The Gates Foundation signed a $200 million partnership. Where competitors spread across consumer products, hardware, and advertising, Anthropic is going deeper into a small set of enterprise verticals where domain expertise builds up across customers.
The most distinctive arrow on the map is the one marked "ad-free." While OpenAI tests advertising and every other platform monetizes attention, Anthropic has publicly committed to keeping Claude free of ads, arguing that advertising incentives are structurally incompatible with a trustworthy AI assistant. The commitment shapes every other arrow on the chart. Enterprise contracts and outcome-aligned vertical products become the only places Anthropic can capture upside, which makes the depth strategy the only viable path. The narrowness of the map is enforced by the revenue model.
Anthropic's lead is a reward for restraint. The map stayed narrow long enough for one loop to dominate, and the rest of the business was built on the strength of that single advantage. The enterprises following the same pattern, picking one workflow, letting it prove out, then expanding from a position of demonstrated value, end up running tighter loops than the ones layering 20 pilots across the org chart.
Microsoft: Distribution without synergy
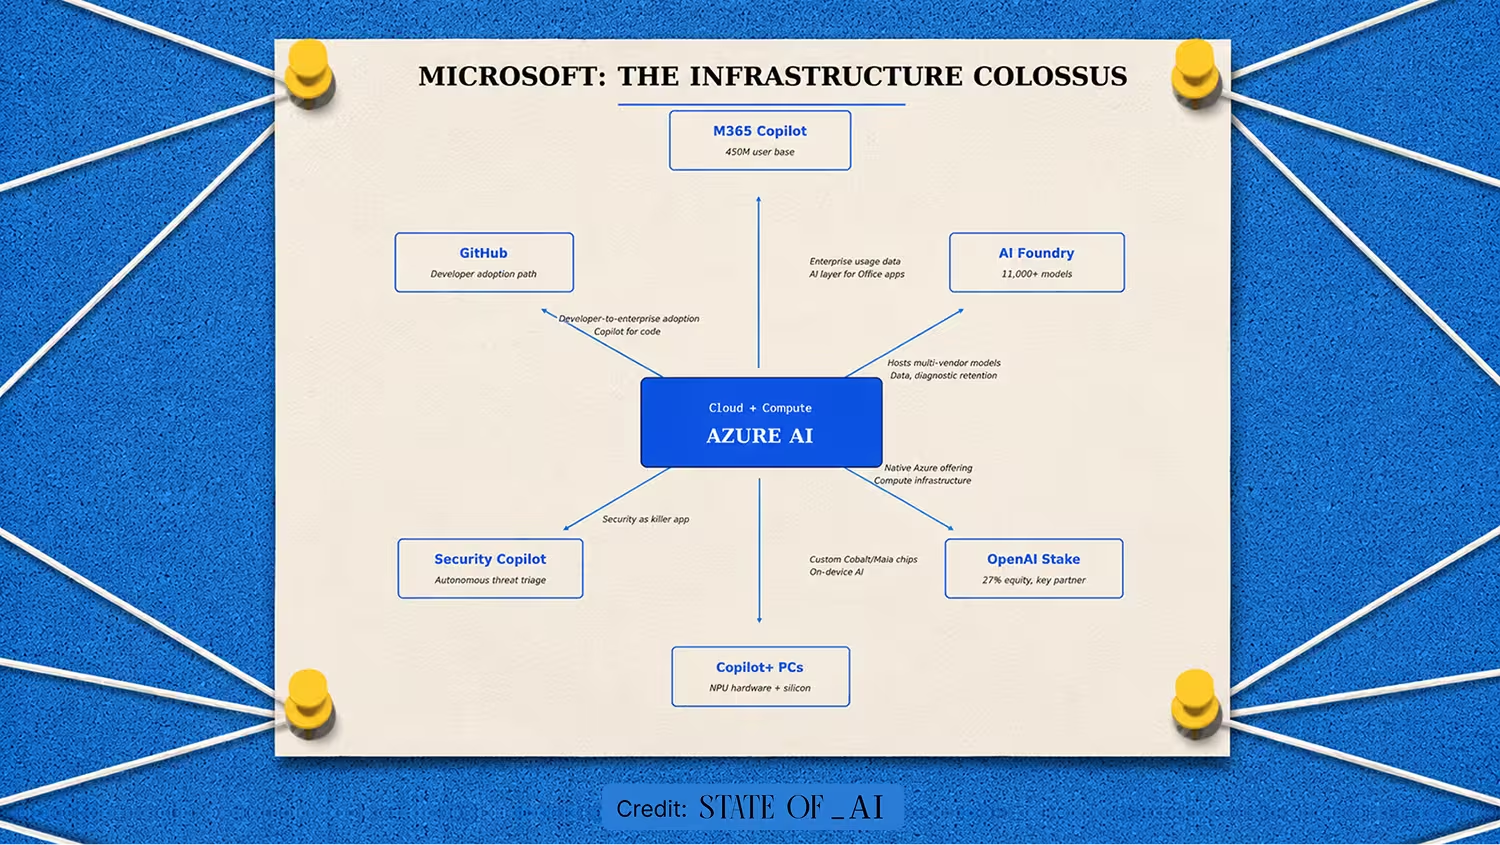
Microsoft's chart raises an uncomfortable question. What happens when the boxes are extensive but the arrows between them stop working?
Microsoft has the largest enterprise distribution footprint of any company in this analysis. Microsoft 365 reached 450 million commercial users. Azure hit a $70+ billion annual run rate, growing 40% year over year. Roughly 85% of the Fortune 500 run some form of Microsoft AI. Four separate agent-building surfaces serve different parts of the stack: Copilot Studio, Azure AI Foundry with more than 11,000 models, Security Copilot, and M365 Agent Builder, alongside an Agent Store carrying more than 70 pre-built agents. Microsoft began shipping custom silicon in its Cobalt 100 CPUs and Maia 200 AI accelerators to reduce Nvidia dependency. Annualized capex sits at $150 billion. On paper, the surface area looks unbeatable.
The conversion numbers tell a different story. Mat Velloso, the former Microsoft Partner Director who spent four years as Technical Advisor to Satya Nadella before moving to Google DeepMind and then to Meta's Superintelligence Labs, wrote in an April 2026 X post that Microsoft "missed the AI wave." Velloso pointed to Copilot's adoption rate: out of 450 million Microsoft 365 users, fewer than 15 million paid for Copilot, a conversion rate of roughly 3.3% despite Microsoft pre-deploying the product into Windows 11, Office, Edge, and the taskbar. Velloso also noted that Bing had not gained a single percentage point of search market share despite billions spent on AI integration. Recon Analytics' AI Choice 2026 study sharpened the picture further. Copilot's share of the U.S. paid AI subscriber market dropped from 18.8% in July 2025 to 11.5% in January 2026, a 39% contraction in six months.
The OpenAI partnership, once the strategic crown jewel, has developed its own tensions. OpenAI accounts for 45% of Azure's $625 billion in remaining performance obligations, making it Azure's largest customer. OpenAI is also actively diversifying its compute, building Stargate infrastructure to reduce sole-source dependency on Microsoft. The partner is becoming less captive, and Microsoft's most important AI arrow is starting to point in two directions at once.
Microsoft's chart is the most useful cautionary tale in the analysis. Distribution does not produce synergy on its own. Launching AI in 20 departments creates 20 standalone tools rather than a flywheel where AI in procurement makes AI in finance better, which makes AI in operations better. The reason Microsoft has 85% of the Fortune 500 using its AI and only 3.3% paying for it is the same reason most enterprise AI pilots underperform. The systems are not connected. The boxes are the inventory. The arrows are the audit.
Google: The full-stack sovereign
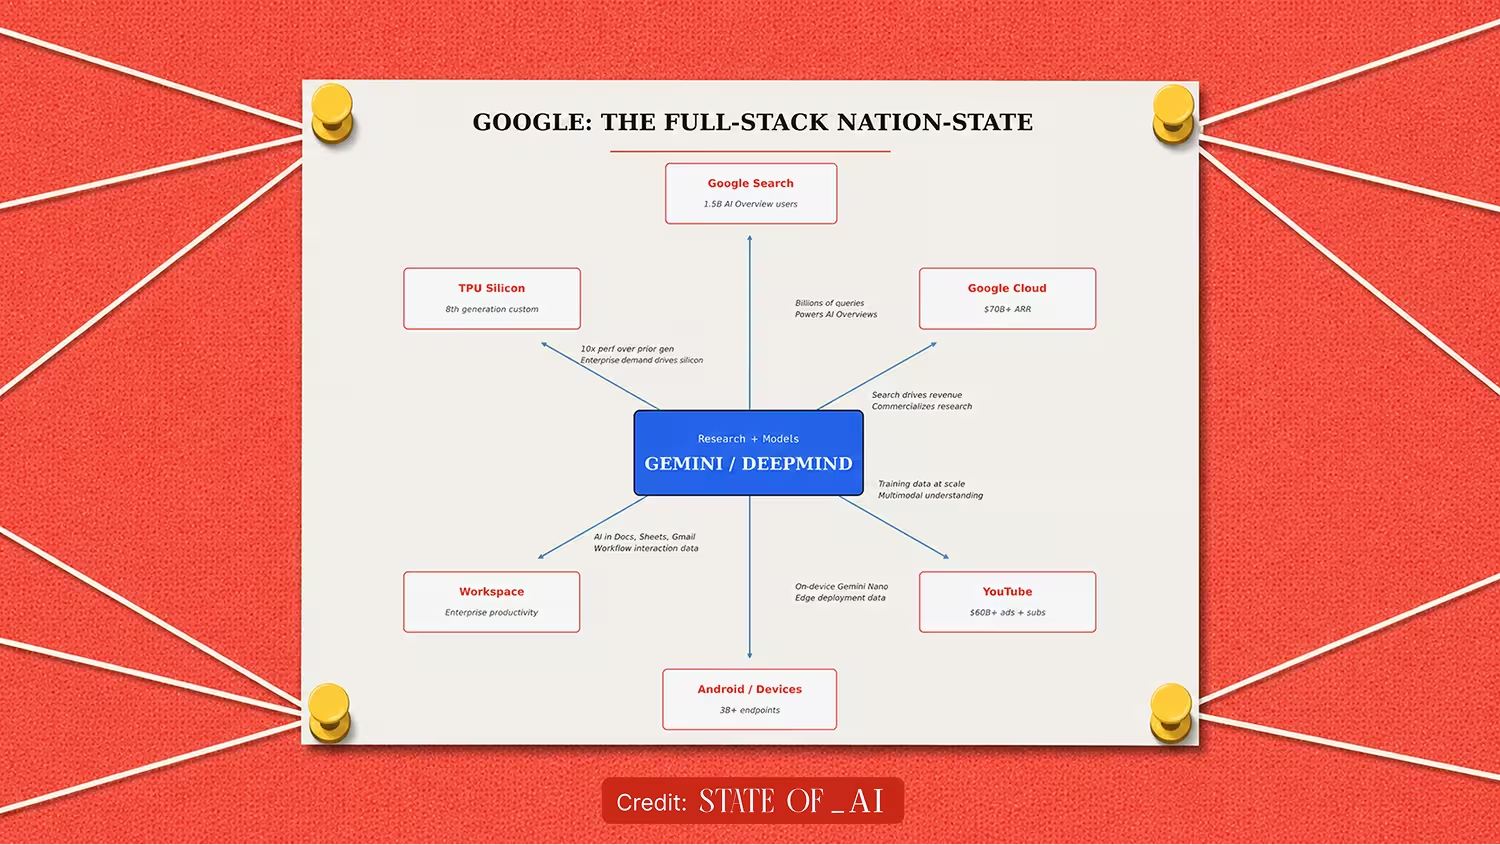
Google's synergy map is the largest in tech by surface area, and what makes it distinct is that Google owns every layer. At the bottom of the stack sit Google's custom TPUs, now in their eighth generation, with TPU 8t delivering 2.7 times the training price-performance of its predecessor Ironwood. The chips train Google's own frontier models, including Gemini 3, which swept the AI leaderboards at launch in November 2025. The models move into a distribution layer no competitor can match: 2 billion users interacting with AI Overviews in Search each month, 750 million monthly actives on the Gemini App, YouTube generating more than $60 billion in 2025 across ads and subscriptions, and Android on 3 billion devices. Funding all of it is one of the largest infrastructure investments in corporate history. Alphabet's planned 2026 capex landed at approximately $180 billion, double the prior year and a six-fold increase over four years.
The size of the chart is not what makes Google dangerous in enterprise AI. The structure underneath it is. Google's stack is fully integrated from custom silicon up through consumer interface, and the integration produces a structural advantage no competitor in this analysis can match: zero internal toll booths. When a query flows from Search to Gemini to Cloud to TPU and back, no margin leaks to a third party at any layer. Every other company in this analysis pays rent somewhere along its own stack. That toll-free position is unique in the field. OpenAI, Anthropic, Microsoft, and xAI each pay external vendors for some combination of chips, compute, or both. Most commonly, that means Nvidia for accelerators and a cloud provider for infrastructure capacity. Google designs its own chips, runs them in its own data centers, and serves models trained on them through its own products. The integration produces a structural cost advantage no competitor in this analysis can match.
The fully owned stack builds on itself across every product Google ships. The company describes its approach as the "one Google" flywheel. DeepMind produces breakthroughs. Cloud commercializes them. Consumer products distribute them to billions through Search, YouTube, Android, and Workspace. Every arrow on the chart flows through infrastructure Google owns, which means every cycle through the flywheel costs less than the equivalent cycle at a competitor. The cost advantage funds the next round of capex, which funds the next generation of TPUs, which lowers the cost of the next cycle. Each turn of the flywheel runs faster than the last.
The most recent crystallization of the strategy is the Gemini Enterprise Agent Platform, unveiled at Google Cloud Next 2026. The platform is a comprehensive system for building, scaling, governing, and optimizing AI agents, with an Agent Marketplace featuring Atlassian, Oracle, ServiceNow, and Workday pre-built agents, Model Context Protocol support for interoperability, and a Universal Commerce Protocol for retail. Google committed $750 million to develop its agentic AI partner network. The platform extends Google's toll-free advantage to enterprise customers. Agents built on Gemini Enterprise run on Google's own silicon, in Google's own data centers, served through Google's own networking, with no external vendor sitting between any two layers.
The cost of integration seams is the lesson sitting inside Google's map. Every point in an AI stack where one vendor's system hands off to another adds latency, cost, data leakage, and misaligned incentives. Designing custom TPUs is not a realistic option for most enterprises. Counting the seams in their own AI architecture is, and most have not. When data infrastructure, model serving, application layer, and user interface live with four different vendors, every arrow on the enterprise chart comes with a vendor taking a cut. The companies running the fewest seams will run the lowest-cost AI in their industries by the end of the decade.
Reading the five maps together
The five companies are pursuing four fundamentally different architectures, and the comparison matters at every level of the AI economy. Enterprises evaluating vendors are buying into one of these architectures, whether they recognize it or not. Investors and strategists tracking the competitive picture are pricing one of these architectures into every position they hold. Anyone watching where AI value will accrue is watching these four bets play out against each other.
The conglomerate flywheel that xAI is attempting is the most ambitious of the four architectures. Proprietary data from across a portfolio trains AI that improves the portfolio, generating more data and tighter integration over time. The bet pays off in a long-run scenario where cross-product data advantages build into a moat that pure-play AI companies cannot match. The trade-off sitting underneath the strategy is execution complexity. Making data flow between systems requires governance, integration, and infrastructure investment that most organizations underestimate, and xAI is currently in the period of paying the costs without yet seeing the returns.
OpenAI's platform play, with Microsoft running a parallel version focused on enterprise distribution, is built on the bet that the surface area of AI usage will keep expanding faster than any one customer can build for themselves. The architecture rewards scale and integration breadth, which is why OpenAI is moving toward outcome-based pricing for high-value workflows. The shift cuts two ways. It raises the ceiling on what platform-layer companies can capture from any single account, and it gives enterprises a reason to build internal agent capability on top of frontier models to keep the upside in-house. That tension, more than any model release, will determine how much value the platform layer holds onto over the next several years.
Anthropic's depth-first model is built on the bet that vertical depth builds faster than horizontal breadth in enterprise AI. Lead with one workflow where AI produces measurable value. Let bottom-up adoption pull the company into expanded contracts. Layer industry verticals on top once the foundation is proven. The architecture has the clearest internal application of the four, because the same sequence works inside an enterprise. Parallel pilots across 20 departments are often a political necessity in large organizations, but the ones that produce compounding value almost always trace back to one anchor workflow that proves out first and earns the right to expand. The order matters more than the count.
Google's full-stack sovereign model is built on the bet that owning every layer of the AI stack produces structural cost advantages competitors cannot match. The architecture is the least directly applicable inside an enterprise, because custom silicon is not on the table for most companies. The principle worth extracting is that every vendor handoff in an AI stack carries some combination of cost, latency, and incentive friction. Vendor concentration carries its own risks, and enterprise governance frameworks keep multiple vendors in the stack for sound reasons. The question is whether the seams in any given architecture were chosen for those reasons, or whether they accumulated by default.
The pattern across all five maps is the one that most AI strategies underweight. Architecture functions as a strategic asset in its own right, and treating it as an implementation detail to be worked out after the strategy is set is what leaves most enterprise AI investments compounding more slowly than they should. The right question is what an organization's own synergy chart looks like, and whether the arrows between its AI initiatives are real or aspirational. Treating architecture as strategic produces a compounding advantage. Treating it as a back-of-the-deck slide produces linear returns at best, and a slow accumulation of vendor lock-in at worst.
What the next five years will reveal
The competitive picture in enterprise AI has shifted from a contest of models to a contest of architectures, and the shift is unlikely to reverse. Every frontier lab now ships capable models. Capability gaps narrow with each release cycle. The advantages that will compound from here are structural, sitting in the surrounding businesses, the data flywheels, the distribution surfaces, and the cross-product arrows that each company has spent the last several years assembling.
The same dynamic is already reshaping enterprise AI budgets. Companies that built their AI deployments as a portfolio of disconnected pilots entered 2026 with sunk costs and incremental returns. Companies that built deployments as a system, with data flowing between use cases and outputs from one workflow feeding the inputs of another, entered 2026 with a clearer view of what the next layer of investment should look like and a measurable cost-per-decision advantage already showing up in their AI economics. The gap between those two groups will widen for the rest of the decade.
Walt Disney understood the principle when he sat down with paper and pencil in 1957. Each division of his company was worth more inside the system than it would have been on its own. The arrows between the divisions were what created the moat, and the moat was what allowed Disney to survive every reorganization, succession crisis, and competitive threat for the next seventy years. The same logic applies to AI architecture in 2026. The choices made in this window, while architectures are still flexible, will determine which companies compete on cost and integration in 2030, and which spend the rest of the decade absorbing the cost of decisions they did not realize they were making.
Draw your own synergy map
The five-step process this analysis used to map the big AI companies works on any business.
- Start with inventory. List every AI initiative across the organization, from production deployments to active pilots to vendor contracts that are not yet generating value. Each one is a box on the chart.
- Identify what each box produces and what it consumes. Customer service AI consumes support tickets and produces resolution data. Coding assistants consume codebases and produce code, telemetry, and developer behavior signals. Most enterprise AI deployments have never been mapped at this level, which is the reason most synergy charts are easier to draw on competitors than on the company itself.
- Draw the arrows. Trace where output from one system feeds another. Trace where it should, but does not. The gap between the arrows that exist and the arrows that should exist is where compounding strategy lives.
- Count the seams. Every place in the architecture where one vendor's system hands off to another is a point of cost, latency, and incentive friction. Some seams are there for good governance reasons. Others accumulated by default. The distinction matters.
- Pick one missing arrow and build it. A single new connection between two existing AI systems will reveal more about the organization's synergy architecture than any strategic planning exercise. Drawing arrows is what builds the map.